 |
 |
The short term traders should watch for signs that effect the market so you can act quickly on any stock market movements. These sign can be obtained from our system easily and within seconds here are some examples , at the member's home page you will see Money Market Signal index pie chart that calculate the count of Buy, Sell, and Hold signal for the stock market for exampole here some scenarios:
1. More Sell than buy the market is going up.
2. More buy than Sell the market is going down. |
|
 |
| At the member's home page you will see another indicators which is the bar chart, and the gauge indicator it is very similar to the pie chart as far as measuring the power of buying or selling of the market, with the exception in the gauge indicators you pay close attention when gauge pin start going to the orange and red area, that might be a very significant reversal risk, the market potential on the verge of reverting the power to the other side. |
|
 |
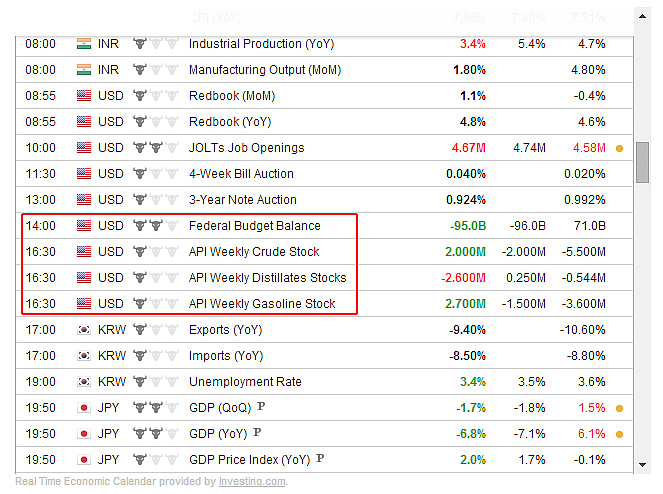
| At the news page you will find the Economic Calendar and it is one of the most important indicator for the coming day, you can see in the following exhibit the federal budget balance, API weekly crude stock, and API weekly gasoline stock these event could move the market up or down based on how strong the report. |
|
 |
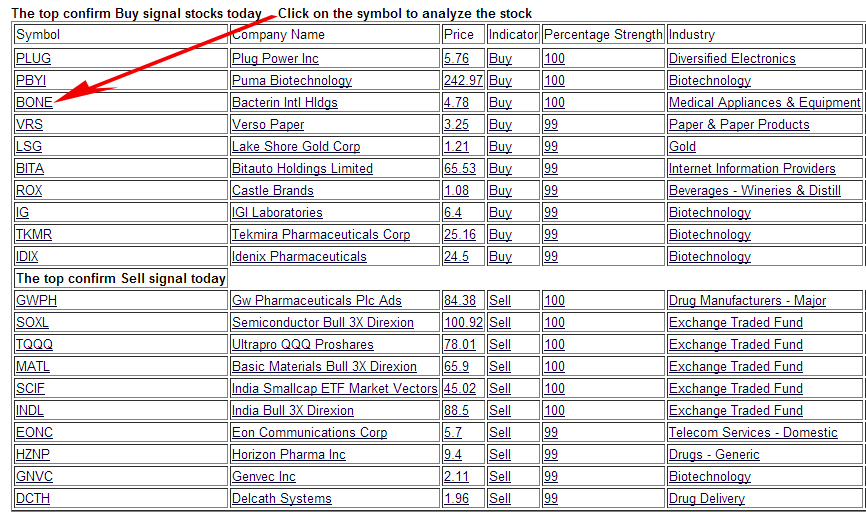
| At the member's home page you will see this table for the top confirmed Buy/Sell signals today.
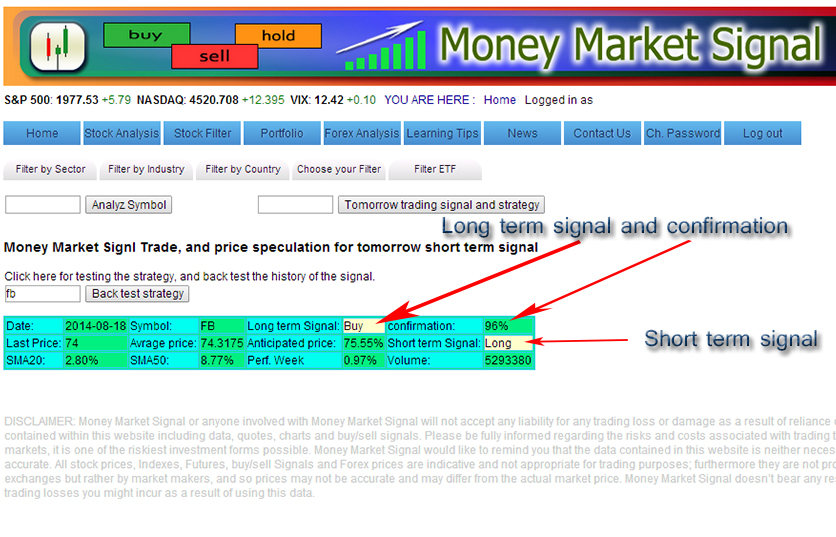
Click on the symbol to analyze the stock, and see Money Market Signal analysis and signals. |
 |
 |
|
 |
 |
|


